From hot mainframes and Energy Star sleep modes to PUE, renewable-powered clouds, circular e-waste systems, green software, and the AI energy debate.
1970s -> PresentPUE -> CarbonCircular IT
Green Computing Ideas
Green computing means designing, using, and disposing of computers and data centres with less energy waste, less carbon, and less e-waste. It grew from electricity bills and Energy Star stickers into PUE metrics, renewable-powered clouds, circular hardware, and software that is written to sip power instead of guzzle it.
This timeline follows that arc from hot mainframes to India’s e-waste rules and green data-centre push—alongside the new debate over AI’s electricity appetite.
Big picture
Green computing evolution in one view
Efficiency moved from sleep modes on PCs to whole-facility cooling design, then to renewable energy contracts and green software practices. The stats below mark early power worries, Energy Star, PUE, and today’s carbon + AI energy debate.
Green computing: less waste heat, smarter cooling, renewables, and circular hardware.
Heat Bills1970s - 1989
Power, Heat and Early Awareness
Mainframes and minicomputers needed serious electricity and air conditioning. Oil shocks and rising utility costs made energy a management issue long before “green IT” became a buzzword.
Early era: compute meant heat, cooling towers, and expensive kilowatt-hours.
Computer rooms designed around cooling as much as CPU.
Energy crises push efficiency thinking in facilities.
PCs later move heat into offices and homes.
Technology Used
CRAC / HVAC: Computer-room air conditioning.
UPS & generators: Keep loads alive through outages.
Facility metering: Track building power draws.
Features
Cost-driven: Green as side effect of saving money.
Centralised rooms: Few sites, high density heat.
Little e-waste policy: Disposal barely regulated.
Sleep Mode1990 - 1999
Energy Labels and Green PCs
Voluntary energy labels for monitors and PCs popularised sleep modes and lower idle draw. Offices began buying “green” desktops; printers gained power-save features. Efficiency entered consumer language.
1990s: sleep modes and labelled efficient devices enter offices and homes.
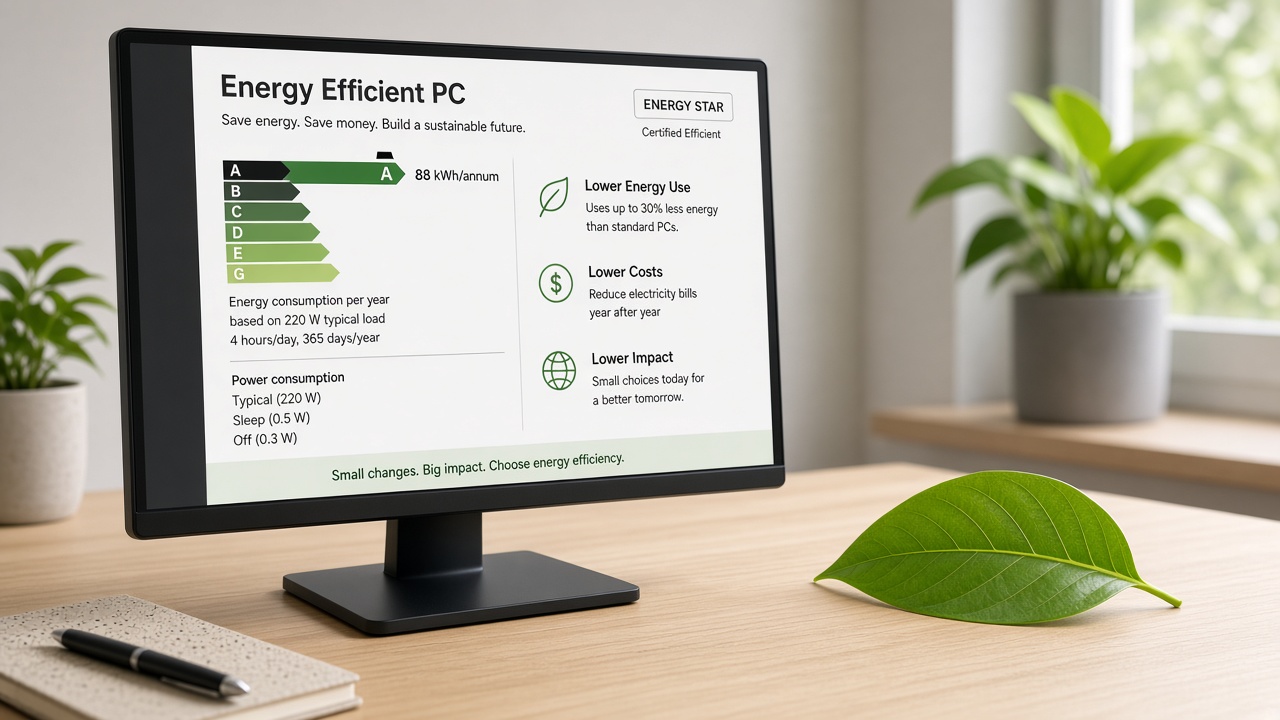
1992: Energy Star programme begins (US EPA) for computers/monitors.
Display power management and standby states spread.
Corporate PC fleets track electricity as an IT cost.
Technology Used
DPMS / ACPI: Sleep and hibernate states.
Efficient PSUs: Better conversion of wall power.
LCD vs CRT: Later LCDs cut display watts dramatically.
Features
User-visible: Monitors go dark when idle.
Procurement: Buyers ask for labelled models.
Still linear waste: Old PCs often landfill-bound.
Facility Math2000 - 2008
Data Centres and PUE
As internet traffic exploded, operators measured Power Usage Effectiveness (PUE)—how much total facility power is used versus IT load. Hot/cold aisles, free cooling, and denser servers became standard playbooks.
PUE era: cooling design matters as much as chip efficiency.
The Green Grid popularises PUE as a benchmark.
Hot-aisle / cold-aisle containment spreads.
Blade servers and virtualization cut idle boxes.
Technology Used
PUE metering: Facility vs IT kilowatts.
Economisers: Use outside air when climate allows.
Efficient UPS: Reduce conversion losses.
Features
Comparable scores: Operators compete on PUE.
Design focus: Airflow before buying more chillers.
Caveat: PUE alone ignores carbon intensity of the grid.
Fewer Boxes2006 - 2014
Virtualization, Cloud and Consolidation
Virtual machines and public cloud let organisations shut down underused servers. Hyperscale operators invested in custom hardware and shared tenancy—often greener per workload than many small on-prem rooms, if utilisation stays high.
Consolidation era: higher utilisation often beats many idle office servers.
Server virtualization shrinks physical footprints.
Cloud regions publish early sustainability reports.
Laptop fleets and thin clients cut desktop watts.
Technology Used
Hypervisors: Pack workloads onto fewer hosts.
Auto-scaling: Turn capacity down overnight.
SSD / efficient CPUs: More work per joule.
Features
Rebound risk: Cheaper compute can increase total use.
Shared responsibility: Apps still waste cycles if poorly written.
Transparency starts: First carbon dashboards appear.
Clean Power2015 - 2019
Renewables, Carbon Reporting and Design
Large operators matched data-centre load with wind and solar purchases, chased waterless cooling, and reported carbon footprints. Liquid cooling and warmer inlet temperatures pushed facility efficiency further.
Renewables era: match compute load with cleaner electricity and better cooling design.
Power purchase agreements for wind and solar scale up.
Corporate net-zero and RE100-style pledges spread.
24/7 carbon matching: Harder than annual averages.
Water stress: Cooling choices matter in dry regions.
Public targets: Investors ask for progress.
Whole Lifecycle2020 - Present
Circular IT, Green Software and AI Energy
Focus widens from PUE to embodied carbon, e-waste, right-to-repair, and software carbon intensity. AI training and inference raise new electricity questions, while green software principles ask developers to measure joules per feature.
Circular era: reuse, repair, recycle—and write software that wastes less power.
E-waste rules tighten; refurbish markets grow.
Green Software Foundation-style practices spread.
AI energy use becomes a public and policy topic.
Technology Used
Telemetry: Measure app energy and carbon.
Efficient ML: Smaller models, better batching.
Circular logistics: Take-back and material recovery.
Features
Beyond the plug: Manufacturing carbon counts.
Demand response: Shift workloads to cleaner hours.
Trade-offs: Digital services can replace travel—or add new load.
Green Computing Timeline Summary
Year / Era
Milestone
Why it matters
1970s–80s
Facility power awareness
Heat and electricity become IT costs.
1990s
Energy labels / sleep modes
Efficient PCs enter procurement.
2000s
PUE & aisle design
Data centres measured as systems.
2006–14
Virtualization / cloud
Higher utilisation, fewer idle boxes.
2015–19
Renewables & reporting
Carbon goals join efficiency goals.
2020s
Circular + AI energy
Lifecycle and software carbon matter.
Key Historical Events
Event
Year
Significance
Energy crises raise facility costs
1970s
Power becomes a board-level concern.
Energy Star for computers/monitors
1992
Mass-market efficiency labelling.
ACPI power management
1990s
Standard sleep/hibernate on PCs.
PUE metric popularised
mid-2000s
Common language for data-centre waste.
Server virtualization boom
2000s
Consolidate underused machines.
Hyperscale renewable PPAs
2010s
Clean power contracts at cloud scale.
Corporate net-zero pledges
late 2010s
Public carbon targets for IT giants.
Green software practices
2020s
Measure and cut software energy.
AI electricity debate
2020s
Training/inference loads scrutinised.
Stronger e-waste rules worldwide
2000s–20s
Producer responsibility expands.
Green Practices at a Glance
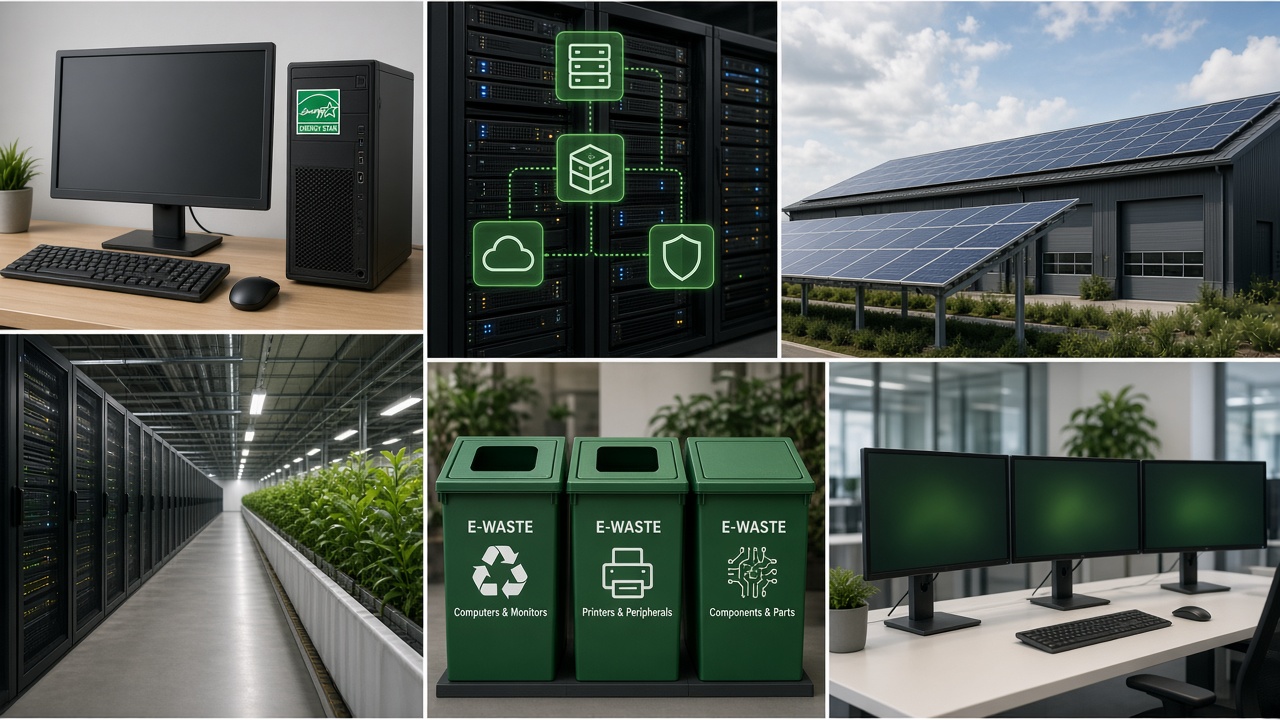
Practice spans hardware, facilities, energy supply, and software behaviour.
PUE: Total facility power ÷ IT equipment power (closer to 1.0 is better).
WUE: Water usage effectiveness for cooling.
CUE / carbon: Carbon linked to energy use.
Utilisation: Idle servers waste embodied and operational energy.
SCI-style software metrics: Carbon or energy per user action (emerging practice).
Then vs Now
Metric
Then (1990s office)
Now (2020s cloud era)
Idle PCs
Often left on overnight
Sleep policies / laptops
Servers
One app per box common
VMs/containers, auto-scale
Facility metric
Rarely tracked
PUE + carbon reports
Power source
Whatever the grid offered
Renewable contracts common at scale
Disposal
Little formal recycling
E-waste rules + take-back
New worry
Monitor watts
AI training energy + water
Future Predictions
2025–2028: More carbon-aware scheduling of batch and AI jobs.
2026–2030: Wider liquid cooling in AI-dense halls; stricter water reporting.
2030s: Circular design becomes default in enterprise procurement.
Ongoing: Balance digital growth with cleaner grids and efficient software.
India spotlight
Green Computing in India
India pairs rapid digitisation with e-waste rules, energy-efficient building codes for data centres, renewable growth on the grid, and digital public infrastructure that can replace paper-heavy processes.
India spotlight: e-waste compliance, greener data centres, and digital services.
2000s
IT boom, rising loads
Offices and BPOs multiply servers and ACs; efficiency becomes a cost issue.
2011+
E-waste rules
Extended producer responsibility frameworks grow for electronics recycling.
2010s
Green buildings & DC design
Newer data centres target better PUE and certified building practices.
2020s
Renewables + hyperscale
Solar/wind growth and new cloud regions raise both capacity and green expectations.
Ongoing
Digital public infrastructure
Paperless services can cut travel and printing—if backed by efficient systems.
E-waste: Formal recycling channels expand, informal sector still large.
Grid greening: More renewables help every data centre’s carbon profile.
Skills: Green IT and sustainable software enter training agendas.
Test Your Knowledge
20 questions on PUE, Energy Star, e-waste, renewables, and India. Click to reveal answers.
Answer: Energy waste, carbon, and e-waste (among other impacts).
Answer: Power Usage Effectiveness.
Answer: Less facility overhead relative to IT load.
Answer: 1992.
Answer: Cooling efficiency in data centres.
Answer: Raising utilisation and retiring idle servers.
Answer: Water usage effectiveness (cooling water).
Answer: Emissions from manufacturing/shipping devices.
Answer: Reuse, repair, and recycle instead of landfill.
Answer: Efficiency gains lead to more total consumption.
Answer: PC power-management states.
Answer: It ignores carbon intensity of the electricity source.
Answer: Writing and running code that uses less energy/carbon.
Answer: High electricity (and sometimes water) for training/inference.
Answer: Producer responsibility for recycling electronics.
Answer: Outside air / climate to reduce chiller use.
Answer: It spreads embodied carbon over more years.
Answer: Shift workloads to cleaner or cheaper grid hours.
Answer: Travel and printing—if systems stay efficient.
Answer: From sleep modes to facilities, renewables, circular IT, and software carbon.
Classroom activity
Students Tasks
Ten prompts on energy, PUE, e-waste, and greener digital habits.
EnergyData centresE-wasteIndia
Explain PUE with a simple numerical example.
List three ways a school lab can waste less power.
Why can cloud be greener—or not?
Compare CRT and LCD energy use historically.
What is embodied carbon in a laptop?
Research India’s e-waste rules in one page.
Debate: should AI training face carbon caps?
Design a poster for circular electronics.
How does a greener grid help data centres?
Propose a green software tip for a website.
Continue exploring
Green computing links power grids, cloud regions, AI energy use, and everyday devices. Explore these connected stories next.
Jump to any other technology timeline on WorldTimelineHub.
Disclaimer: This content is AI-generated for educational purposes and may contain errors or outdated details. For correct and authoritative information, please refer to official and reliable sources such as government publications, manufacturers, museums, and academic references.